
Polar coordinate system for periodic Kodom plots
coord_kodom_periodic.RdA convenience wrapper around ggplot2::coord_polar() with defaults
appropriate for geom_kodom_periodic(): theta = "x" (time maps to
angle), start = pi/2 (x = 0 at 12 o'clock), and direction = -1
(clockwise). Pass clockwise = FALSE for a counter-clockwise layout.
Value
A ggplot2::coord_polar() coordinate object.
Examples
# \donttest{
library(ggplot2)
df <- data.frame(
subject_id = rep(1:5, each = 4),
time = rep(1:4, 5),
visit_month = rep(1:4, 5),
value = rep(1:4, 5),
hba1c = rep(1:4, 5),
arm = rep(c("Treatment", "Control"), c(12, 8))
)
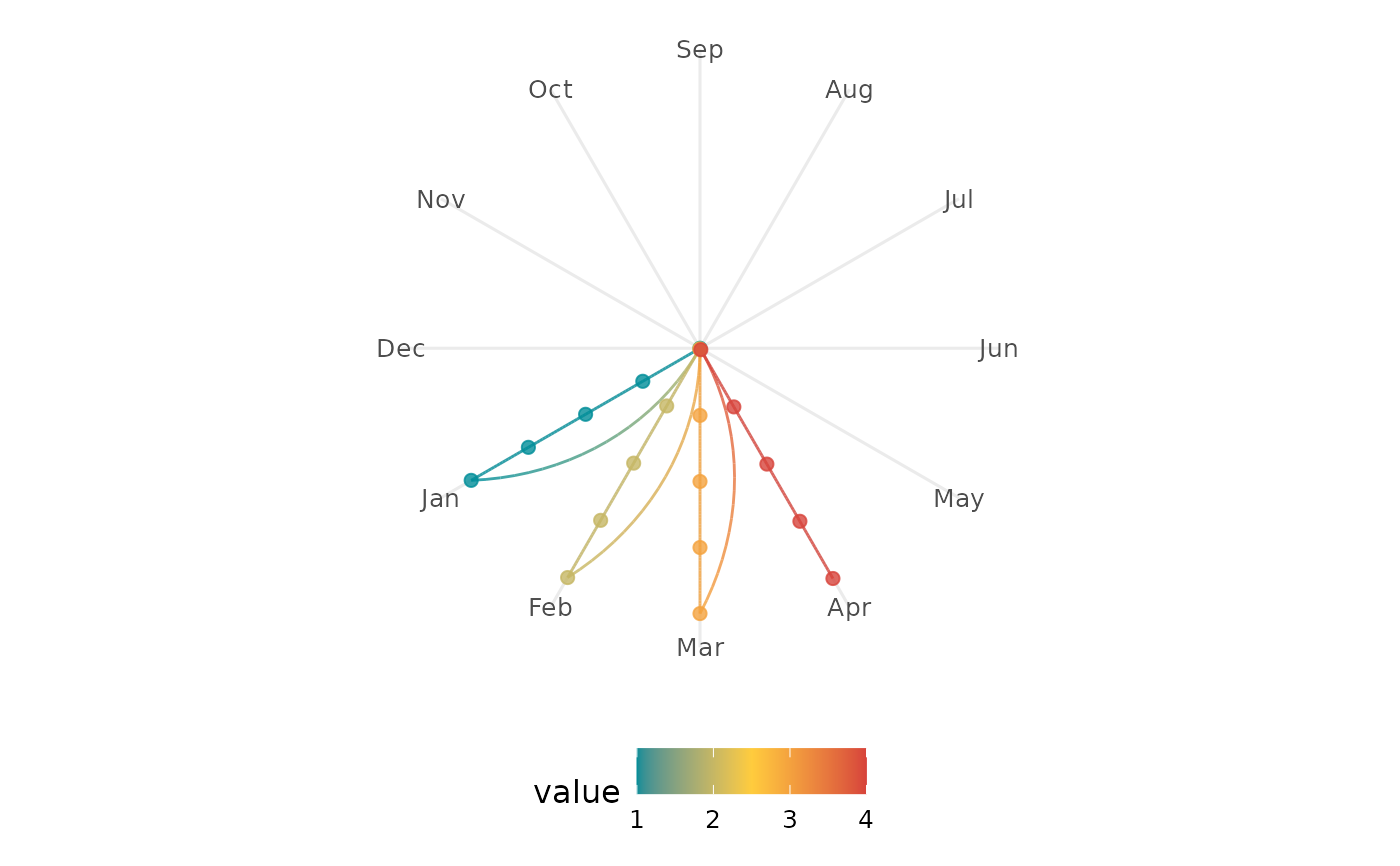
ggplot(df, aes(x = visit_month, id = subject_id, colour = hba1c)) +
geom_kodom_periodic(period = 12) +
scale_x_continuous(breaks = 1:12, labels = month.abb, limits = c(0, 12)) +
scale_colour_kodom() +
coord_kodom_periodic() +
theme_kodom_periodic()
 # }
# }