
Radial scale for periodic Kodom plots
scale_y_kodom_periodic.RdIn coord_polar(theta = "x"), ggplot2 sets the center of the plot to the
minimum data y value, not to zero. Because geom_kodom_periodic() stores
the hollow-center gap as an offset above zero (inner_fraction * n_lanes),
the gap is invisible without this scale: the auto-range simply absorbs it.
Arguments
- expand
Passed to
ggplot2::scale_y_continuous(). Default adds 5% padding beyond the outermost ring and no padding at the center.
Value
A ggplot2::scale_y_continuous() object.
Details
This function pins y = 0 at the center by setting limits = c(0, NA),
so the offset computed by inner_fraction becomes a visible donut hole.
It should be added to every plot that uses geom_kodom_periodic().
Examples
# \donttest{
library(ggplot2)
df <- data.frame(
subject_id = rep(1:5, each = 4),
time = rep(1:4, 5),
visit_month = rep(1:4, 5),
value = rep(1:4, 5),
hba1c = rep(1:4, 5),
arm = rep(c("Treatment", "Control"), c(12, 8))
)
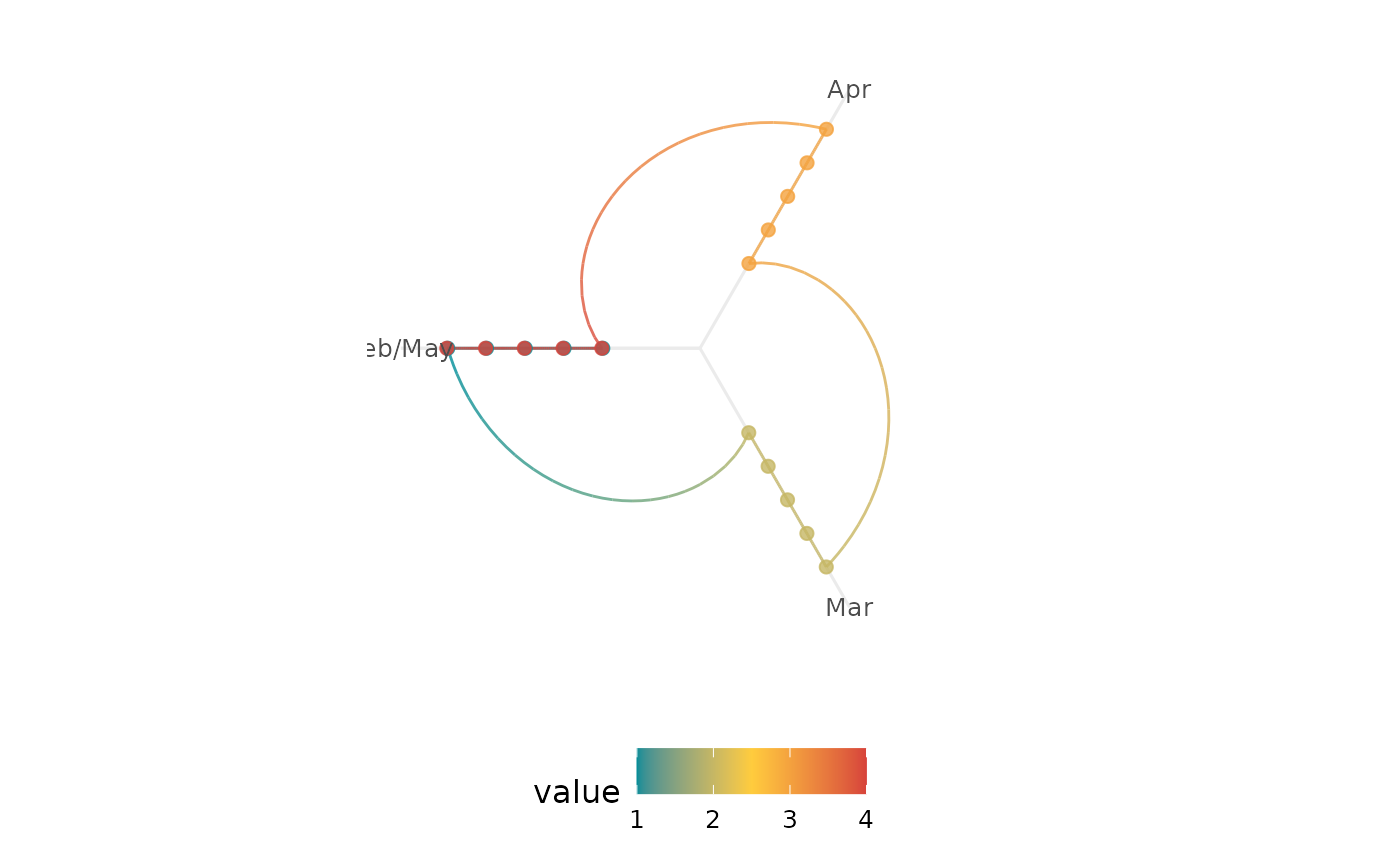
ggplot(df, aes(x = visit_month, id = subject_id, colour = hba1c)) +
geom_kodom_periodic(period = 12, inner_fraction = 0.3) +
scale_x_continuous(breaks = 0:11, labels = month.abb) +
scale_y_kodom_periodic() +
scale_colour_kodom() +
coord_kodom_periodic() +
theme_kodom_periodic()
 # }
# }